Creating a Nautical Chart in QGIS 2.4

Continuing with a nautical theme, here is a nautical chart I creating using QGIS 2.4. It includes a Graticule in decimal degrees, a Compass Rose and a scale bar in Nautical Miles. A magnetic declination of 3º 35′ was determined using the MagneticField utility of GeographicLib, an advanced software library for solving geodesic problems. I will post a full tutorial shortly.

Nautical Chart for North Dublin Bay

The Coastal Vignette

Vignette2

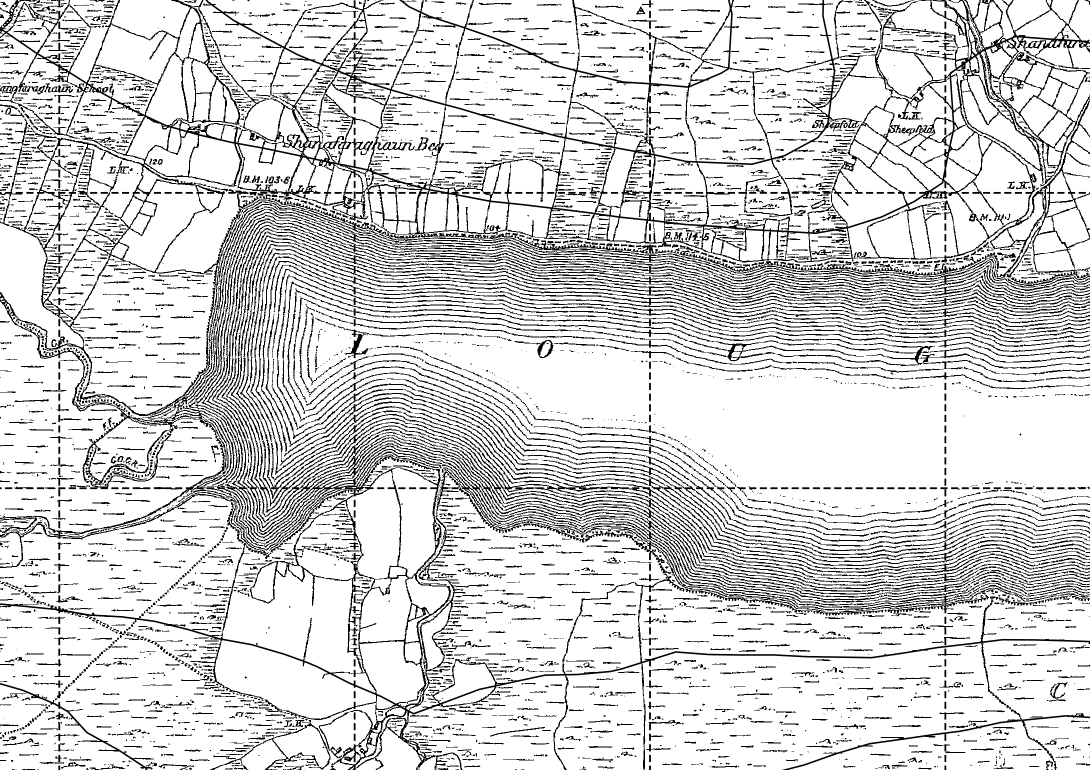
Coastal Vignette seen on an old Irish ‘6-Inch map’

Occasionally on old maps you may see a pleasing decorative effect on bodies of water called a “Coastal Vignette”, these are fine lines that highlight coastlines and lake shores. The example seen above is from a ca. 100 year old “6-inch map” of Lough Nafooey in County Galway, Ireland. I presume the Coastal Vignette effect in this example was hand drawn, it required considerable skill and patience.

These is no plugin for creating Coastal Vignettes in QGIS just yet, so I developed a simple technique to recreate the effect using the raster Proximity (Raster Distance)’ algorithm accessible in the Processing Toolbox.

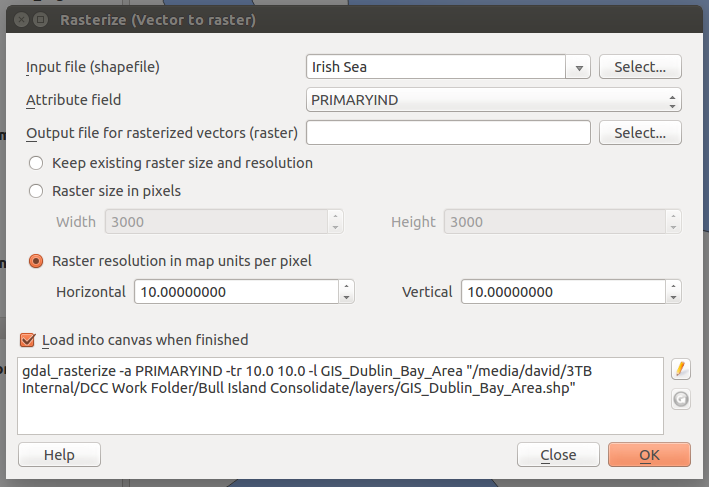
In order to use the Proximity Analysis tool I first converted a Shapefile polygon depicting the sea off Dublin into a 10 by 10 metre resolution Raster using the menu command ‘Raster – Conversion – Rasterize (Vector to raster)’.

Box

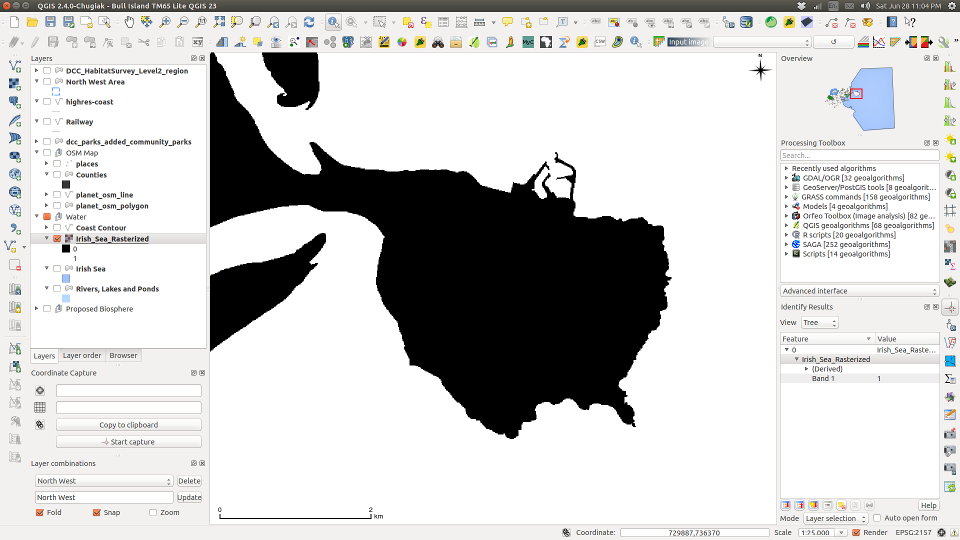
This generated a Raster that coded the Sea as ‘1’ (white) and ‘0’ (black) for Land.

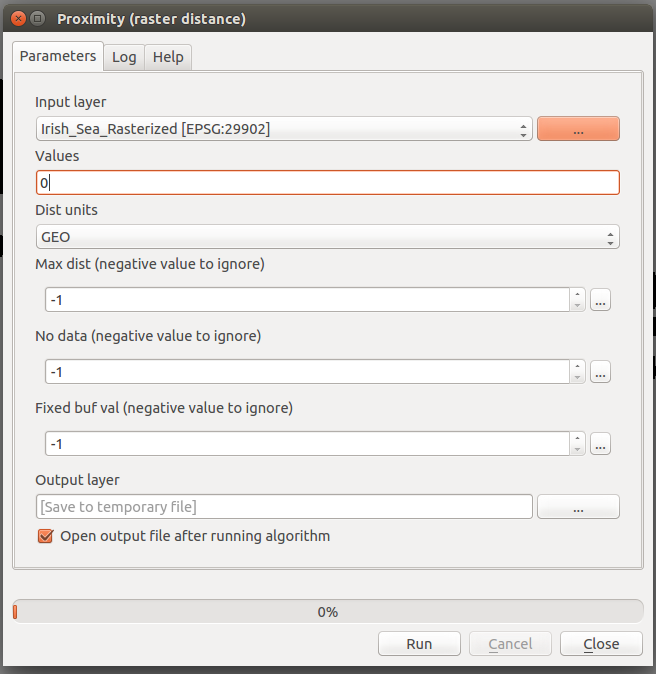
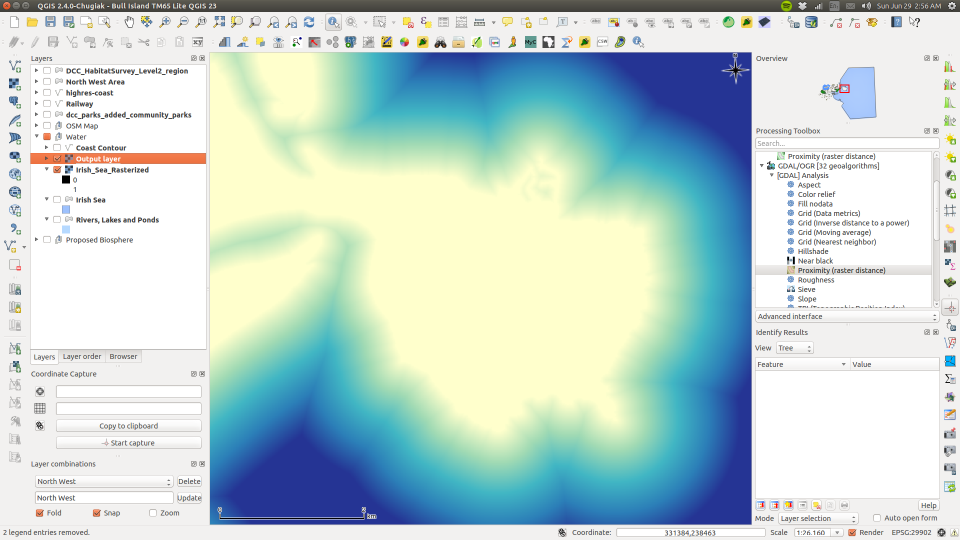
Next, I selected ‘Proximity (raster distance)’  from the Processing Toolbox – (GDAL/OGR) – [GDAL] Analysis – Proximity (raster distance). You can quickly find the command by typing the algorithm’s name in the box above the Processing Toolbox.

Screenshot5

I entered 0 in the ‘Values’ box, this tells the Proximity algorithm to measure the distance away from land (a value of 0). The resulting Raster contains cell values that correspond to the distance away from the coast in metres, which I styled below.

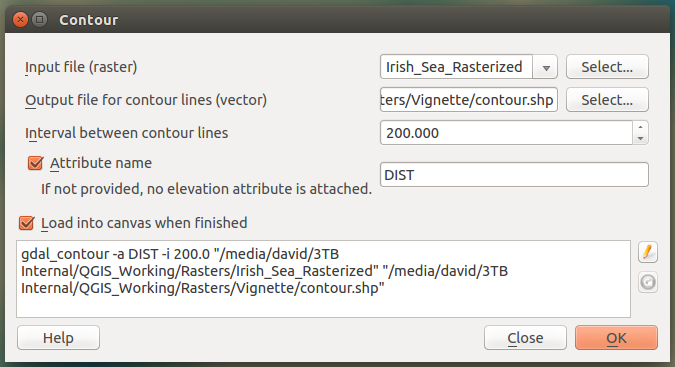
The final step is to create Contours Lines from the Proximity analysis result using the menu item Raster – Contour. In my case I used an “interval between the contour lines” of 200 metres and I added an Attribute name called “DIST”.

Screenshot7

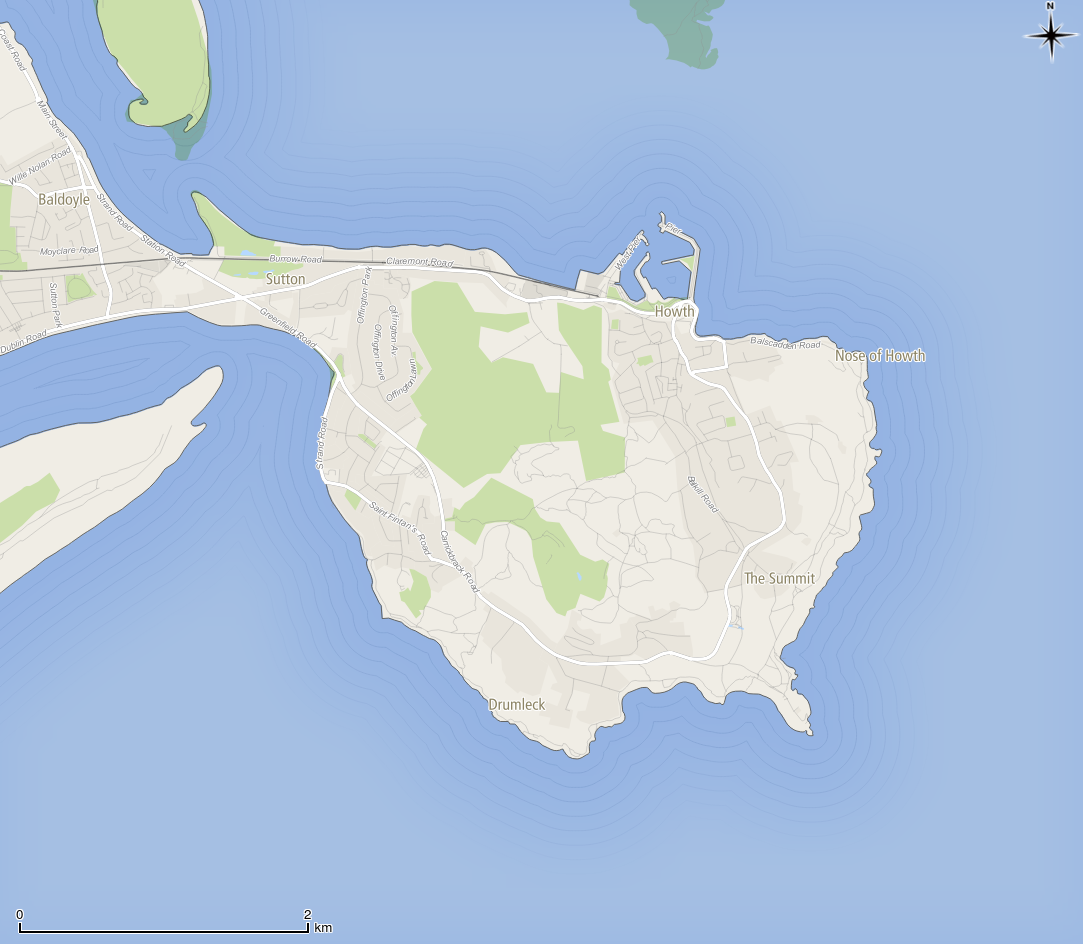
The resulting contour lines have distance attributes attached to them can be used to create a Graduated colour style if needed, though in my cause I manually edited the attributes of 10 contour lines nearest the coast and I gradually increased the transparency of the mid-grey contour lines from opaque at the coast to fully transparent out at sea. I made the remaining contour lines transparent.

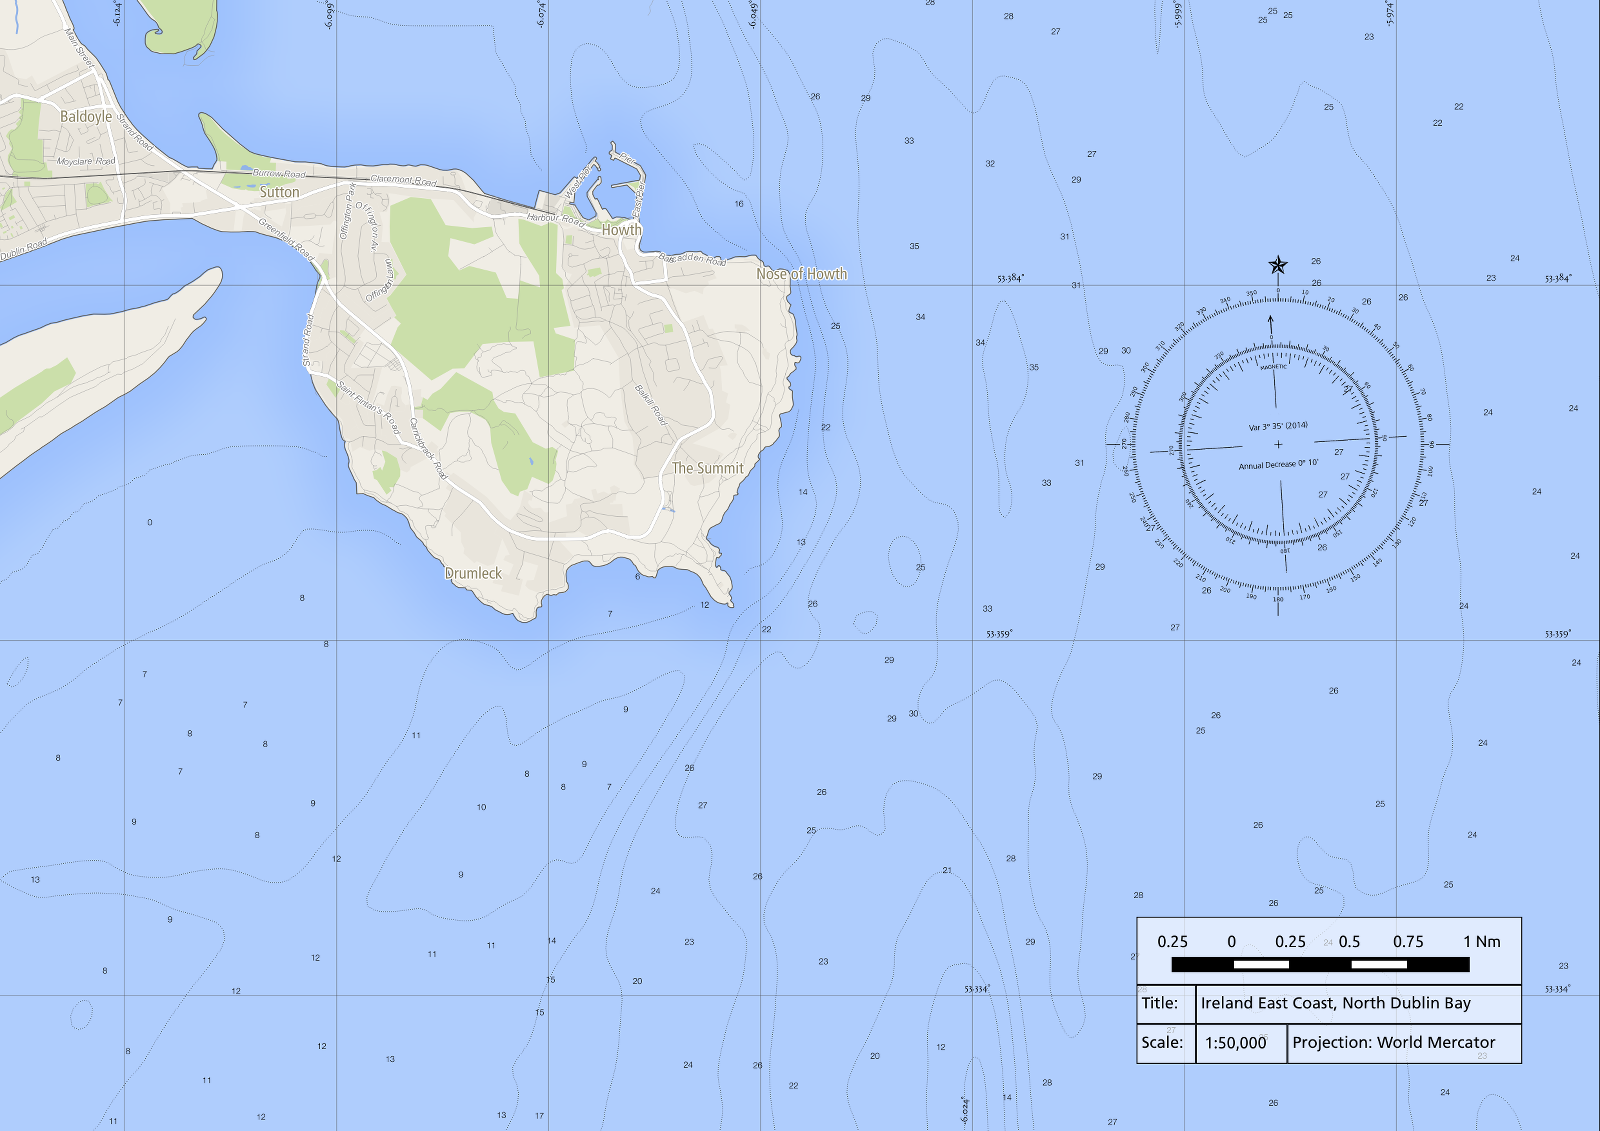
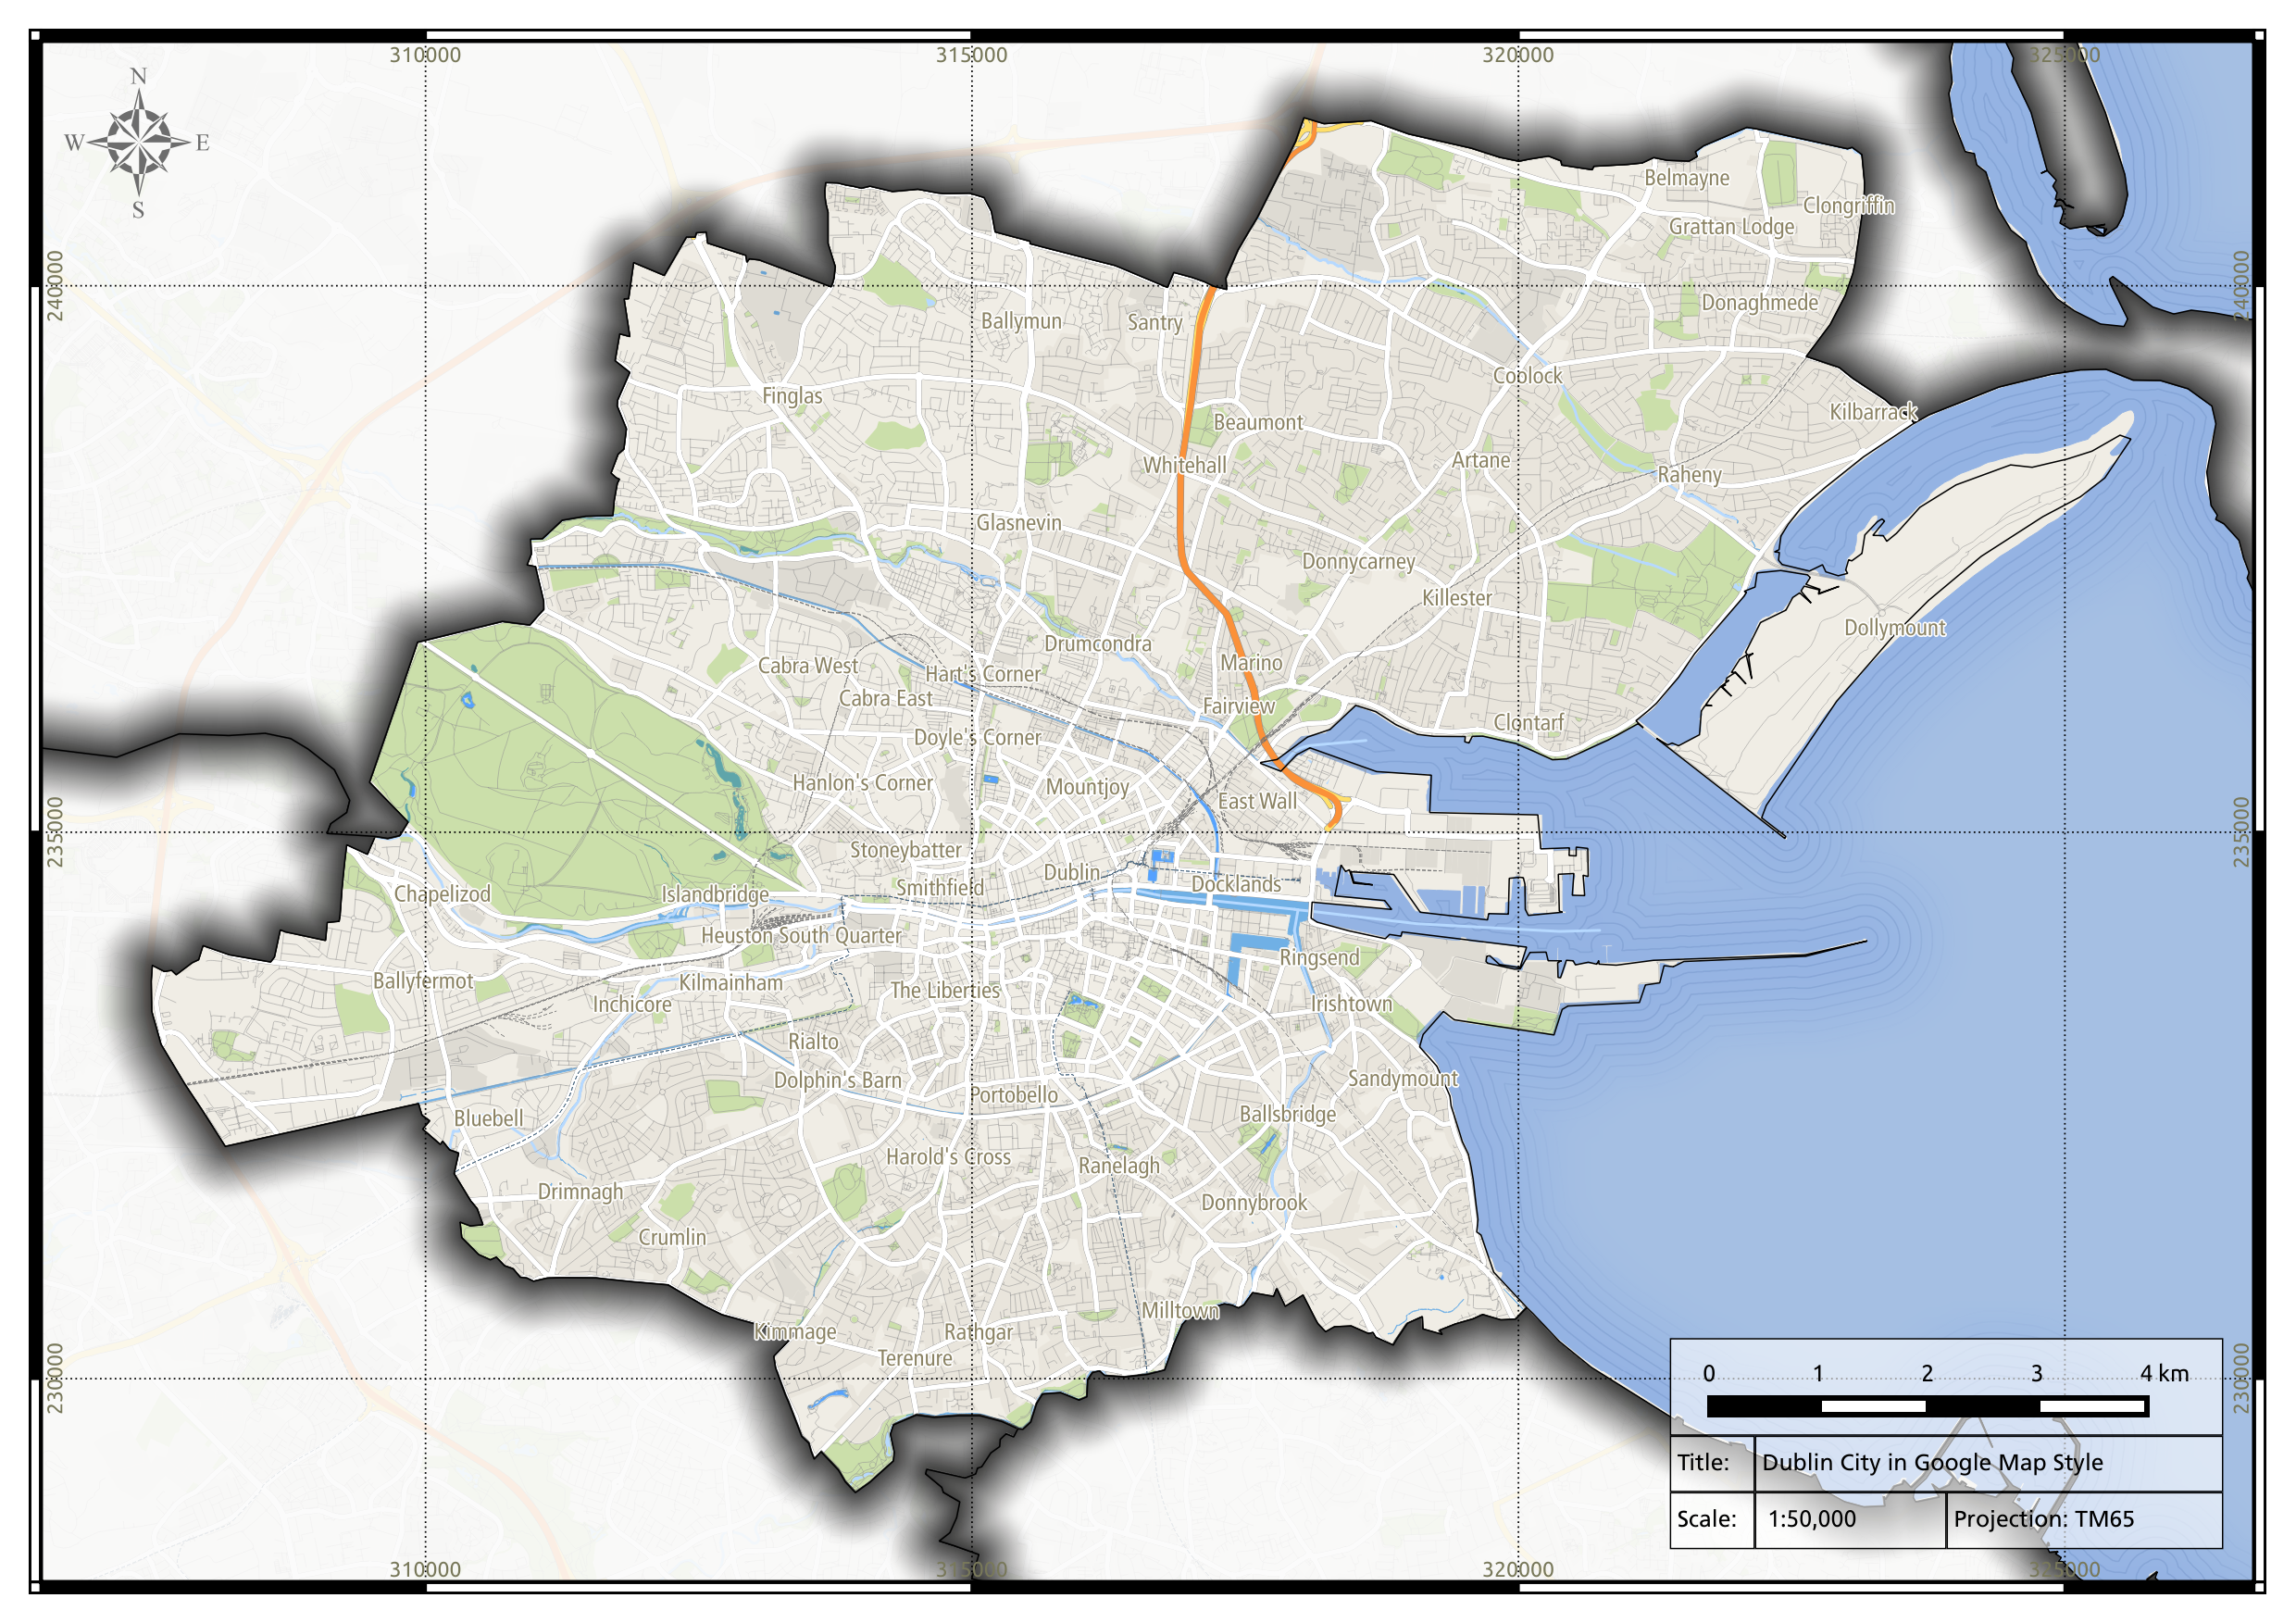
And here is the finished result, with the Sea and an OpenStreetMap base map styled to look just like Google Maps.

Finished Vignette 2

Google Map Style with “Shape Burst” effect in QGIS 2.3

Here’s a nice looking map I created using QGIS 2.3, the testing version of QGIS. I downloaded free OpenStreetMap data and I styled it to look just like Google Maps, as per instructions published by Anita Graser. I also outlined county boundaries using the new “Shape Burst” effect, which creates a pleasing graduated colour pattern that faithfully follows polygon outlines (it’s also applied to the Sea, though it’s quite subtle). I used Data Defined Properties to restrict the effect to all counties except Dublin City, this also created a Mask.

Lastly, there’s also a subtle “Coastal Vignette” effect, these are fine lines that trace the coastline and were typical of old style hand drawn maps. Must have taken a tremendous amount of patience. I developed a simple method of reproducing the effect and I’ll let you know how I did it in my next blog post. Oh and by the way, the scale relates to a map printed at A3 size.


New Online Beginners Course in QGIS 2.2

A US government funded education institution, the National Information Security and Geospatial Technologies Consortium (NISGTC), is offering a free online beginners course to QGIS 2.2 (GST 101 QGIS 2.2). The seven module course is based on the Introduction to GIS course run by Rick Smith with new course material and tutorials specific to QGIS added by Kurt Menke. The course is in beta form at this time with an official launch planed for August 2014 on GitHub, enrolment is open to all.

Here is the course introduction:

Welcome to the QGIS introductory GIS course.  Please note that this course shell is in beta.  We appreciate your willingness to evaluate our course material in preparation for publication in August 2014.  We are very excited that this new series of five complete GIS courses, all based on Open Source Software, will provide educators the curriculum and tools they need to adopt open source GIS software into their GIS programs.

We ask that you follow the sequence of modules presented in the Modules and complete the lab assignments one at a time.  You are welcome to make remarks on either in the discussion area for each module.  Please note that this is a self-paced, open enrollment, course without instructor support or presence.  We make this material available to the public for their own use.  We will publish the course officially on Github in August 2014.  Anyone is welcome to reuse any of the material at that time for their own courses, with attribution under Creative Commons BY license.

NISGTC: GST 101 QGIS 2.2. Course Enrolment Page

10 years of QGIS on Google Trends

Here is a graph showing how often people entered the search term “QGIS” into Google over the last 10 years. It was generated using Google Trends, a Google utility that displays trend graphs and basic regional statistics of search terms entered into the world’s most popular search engine.

QGIS on Google Trends

It’s also possible to compare search terms e.g. QGIS v’s MapInfo, QGIS v’s Microstation, QGIS v’s Geomedia and finally QGIS v’s ArcGIS.

The frequency of most GIS related search terms entered into Google, except “ArcGIS” and “QGIS”, have decreased considerably over the last 10 years. Only ArcGIS is entered into Google more often than QGIS nowadays, indeed ArcGIS has likely attained a monopoly market position. However, it is likely that QGIS will continue to gain ground on ArcGIS and desktop GIS may become a dichotomy of commercial and opensource software, a reaction to one companies’ market dominance.

QGIS Wrocław, Lisboa, Dufour, Valmiera and ?

QGIS 2.4 will be codenamed “Chugiak” in honour of the project founder Gary Sherman who lives in Chugiak, Alaska. This will be the 6th release to bear a codename named after a terrestrial locality, versions 0.8.1 through 1.5 were named after the moons of Jupiter and Saturn e.g. Titan, Io, Tethys etc. The tradition of naming QGIS releases after celestial and terrestrial locations aims to reduce legal risks involving trademarks. QGIS 2.4 will be released at Noon Alaska Time on Friday 20th June (21:00 Irish Standard Time).

Announcement – Swiss QGIS User Group